GIS & Data Analytics

Geolocation Intelligence and Clean Data for Mini-grid Setups

Sustainable Development Goal 7 is one of 17 Sustainable Development Goals established by the United Nations General Assembly in 2015

Overview:

Energy access is essential for proper healthcare service delivery. Healthcare facilities in Nigeria require electricity for lighting, emergency procedures, and storage of vaccines and drugs. Unfortunately, Nigeria’s grid electricity supply has stalled at around 4GW on average and covers only about 57 percent of the population. According to the World Bank, of the 16,900 public healthcare (PHC) facilities in Nigeria, 81 percent lack a reliable power supply. A recent study conducted in the Federal Capital Territory (FCT) shows that power supply to PHCs is intermittent, with an average of 4 hours or less daily. It is worse for facilities not connected to the grid as they rely solely on expensive fossil fuel generators to provide electricity. These generators contribute to both ambient noise and air pollution and are unsuitable for healthcare environments.

Globally, there is a growing interest in alternative power sources, including mini-grids and off-grid solar, which can be highly effective in helping to achieve Sustainable Development Goal 7 (SDG7) by 2030.

The government of Nigeria, other major corporate industry players, and the private sector have worked for years toward realizing the SDG 7. The aim is not just to achieve it but also because lack of or epileptic power supply in public healthcare centers can be life-threatening. Despite the large strides already made, the mini-grid market is yet to reach a tipping point at which it can expand without support. To achieve this, funding is required, but also, getting the right geolocation solution and clean data for informed decision-making remains a challenge. 

The Challenge:

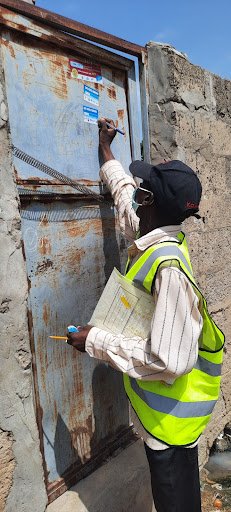
Despite the great strides and enormous support made by the government and other stakeholders to ensure that renewable energy is an established, cost-effective alternative source of power in Africa, implementation is still lagging. For example, identifying the right site for a mini-grid may not be easy in Africa because not every region is mapped and assigned a geolocation coordinate. Demography data on residents within some remote and/or security-challenged regions are difficult to find.

A report by the African Development Bank on Green Mini-Grids in Sub-Saharan Africa has  identified the lack of up-to-date and reliable data as a  barrier to the growth of mini-grids in Africa. As businesses become more reliant on data, the importance of data quality has increased. Data analytics are used to help drive business decisions, therefore, it is important that data must be accurate, complete, reliable, relevant, and timely for it to be trusted. Getting a data set that meets these criteria requires an innovative approach that includes diligence, dedication, and quality assurance throughout the collection process.


The Solution:

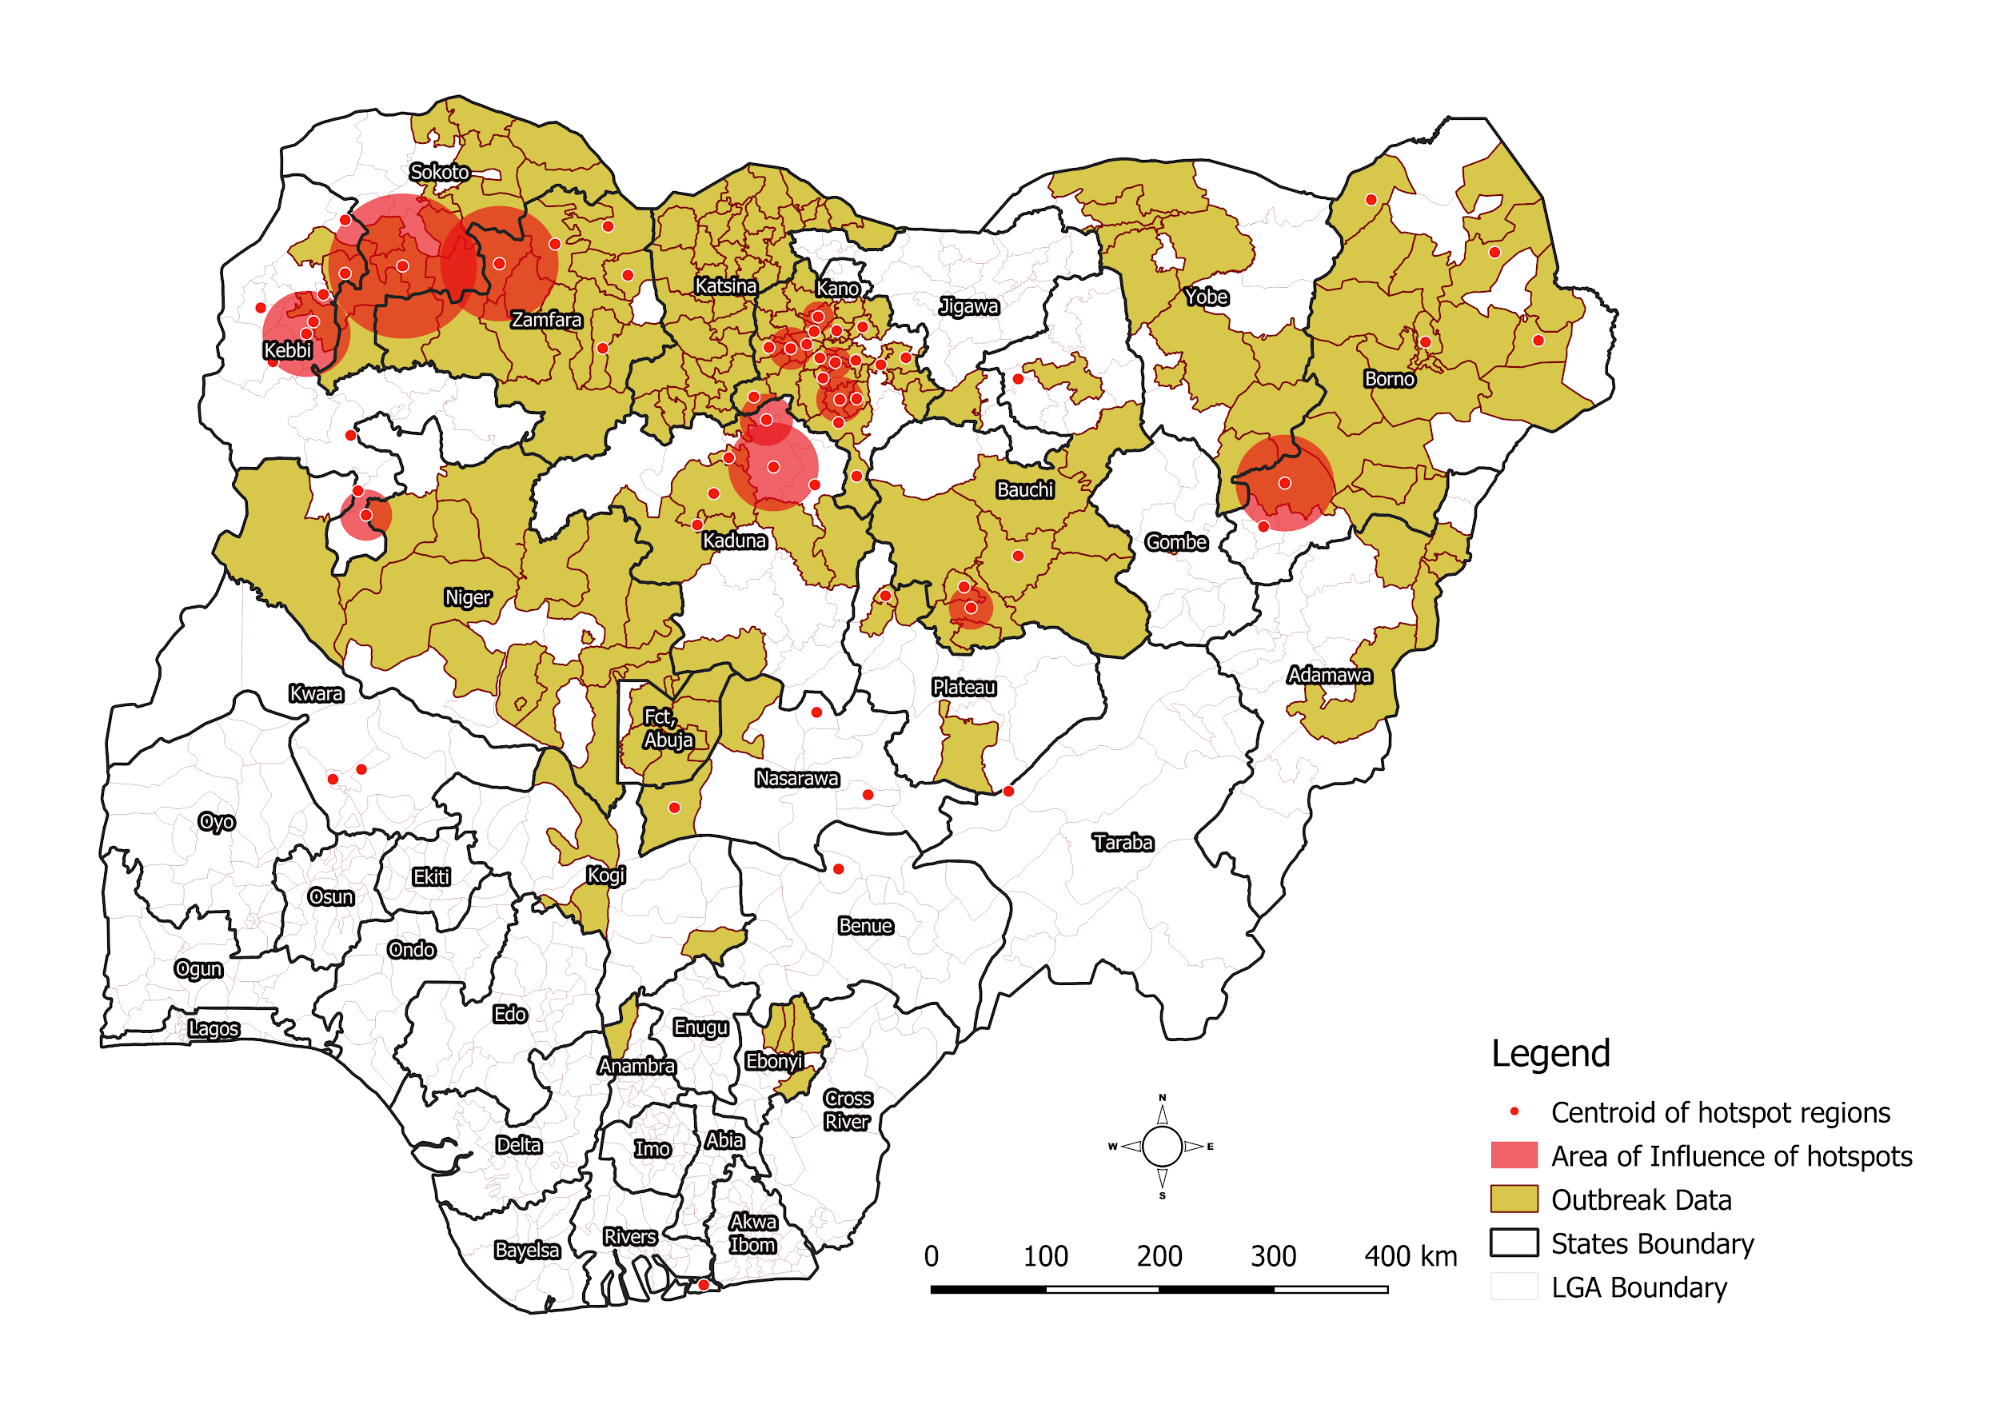
Geospatial intelligence is achieved by visualizing and analyzing geographical data. Organizations can use intelligence tools to identify where an event has taken place, why it is happening, and what caused it by adding layers of geographical information, such as demographics, traffic, and weather data, to smart maps and dashboards. “It’s one of the hottest technologies out there,” said Professor Sunil Bhaskaran, founding director of the Geospatial Center of the CUNY CREST Institute (BGCCCI) at Bronx Community College.

A geospatial platform created by eHealth Africa is The Data Portal. A result of several years of geospatial data collection across Nigeria and some parts of Africa. It contains up-to-date data on points of interest, including schools, settlements, health facilities, and roads, including their population estimates. 

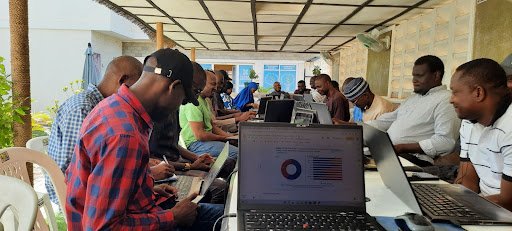
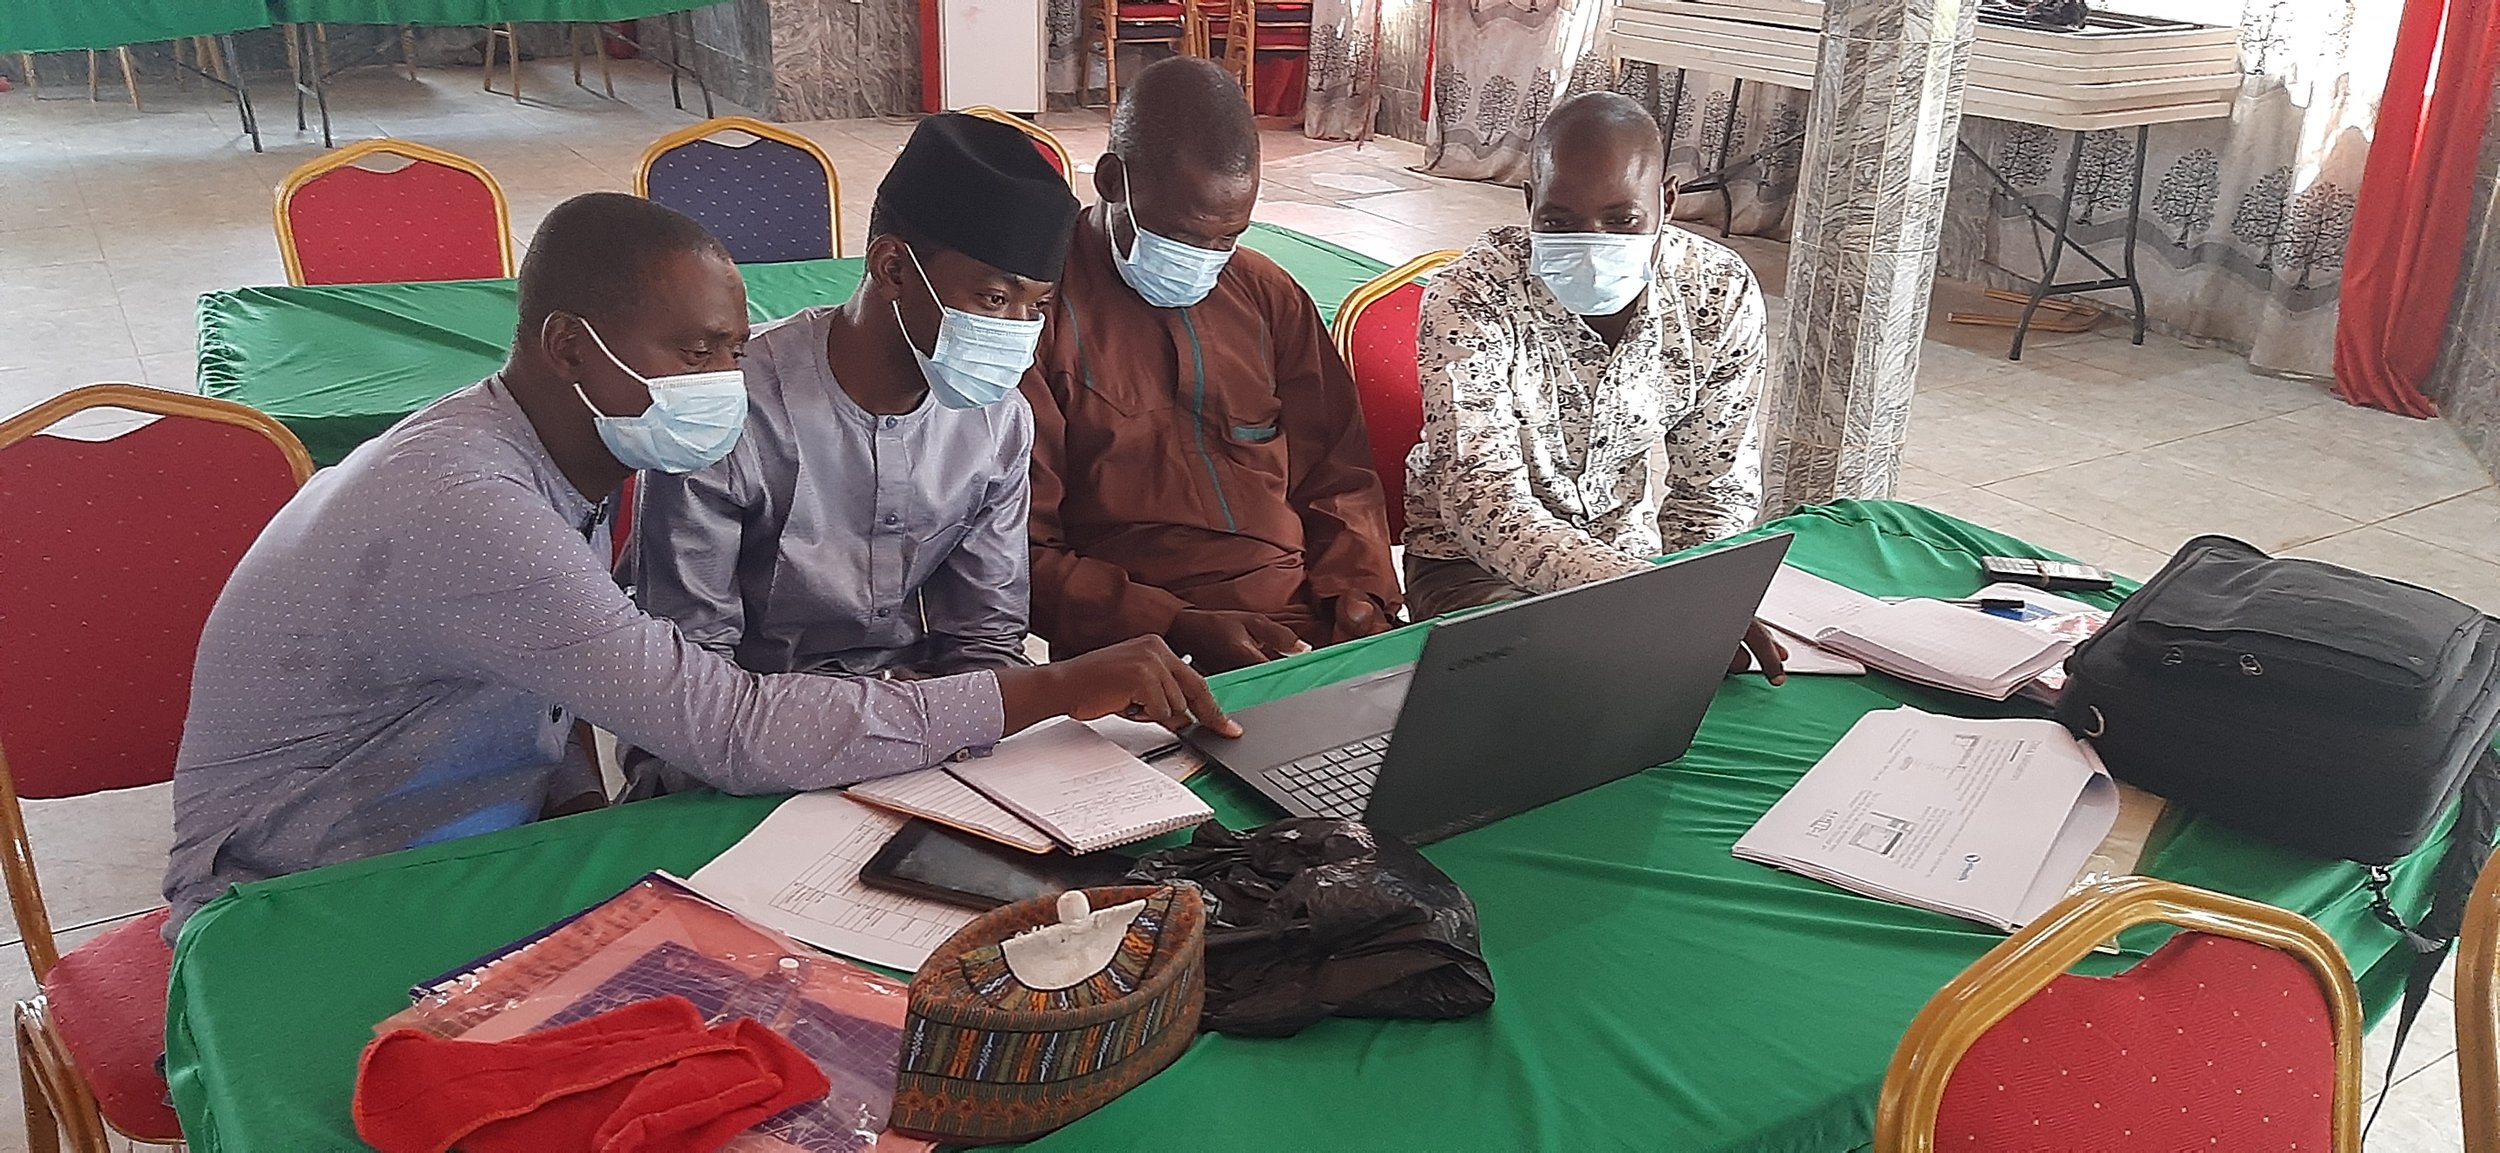
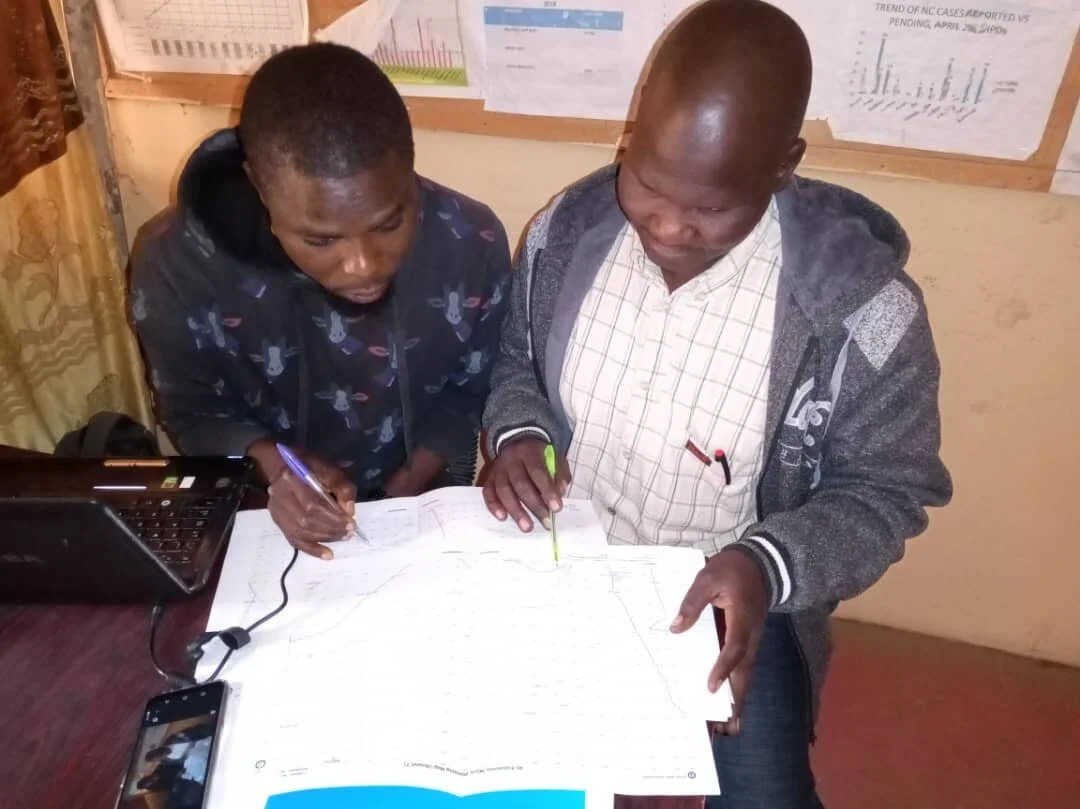
The goal of the data portal is to make existing geospatial data accessible and reusable. This will allow organizations to focus resources on programmatic data rather than base geospatial data for their planning and monitoring across Nigeria. A GIS expert with eHealth Africa, Fashoto Oluwatosin Busayo, spoke on the effectiveness of the data portal, “geospatial intelligence is proving to be a more effective way of allocating energy resources than traditional methods. Using this method, it is possible to identify areas that lack access to energy or are underserved. eHealth Africa has provided training on map production and micro-planning with geospatial data freely available on its data portal to various stakeholders” he said.

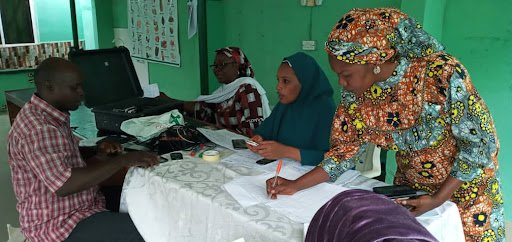
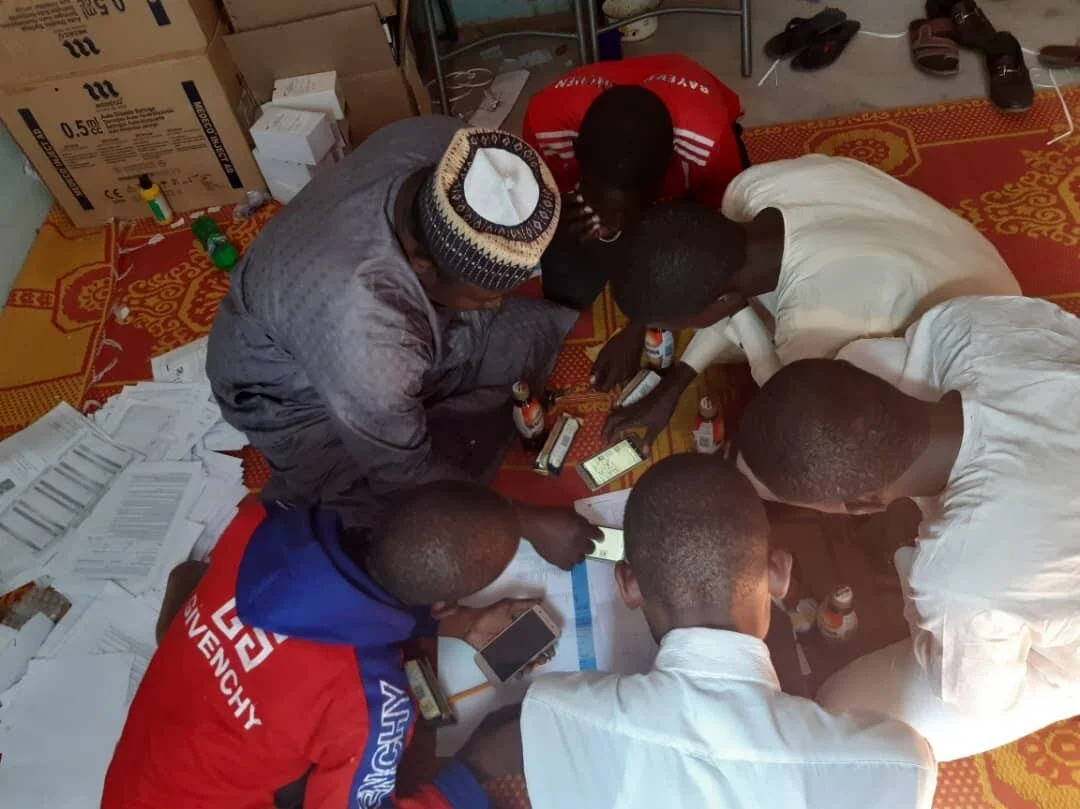
eHealth Africa’s recent project on Remote Assessment of Energy Gaps in Selected Health Facilities, used the remote survey method of data collection to get accurate, reliable data from 291 health facilities in Kano and Osun states, and 300 health facilities in Nasarawa State. “We deployed this method because it is reliable in security-challenged environments like Nigeria. It is also less expensive. Trained helpdesk agents conducted the remote surveys at eHealth Africa.” said the project manager Mohammed Bello.

eHealth Africa is committed to the design and implementation of innovative data-driven solutions for public health interventions across Africa.

In Nigeria, eHealth Africa uses GIS Tracking to Prevent Seasonal Malaria

By Mohammed Bello, Victoria Onyilokwu and Zakariyau Aliyu

In March 2012, the World Health Organization (WHO) issued a policy recommendation on Seasonal Malaria Chemoprevention (SMC), a new intervention against plasmodium falciparum malaria. This intervention has proved efficient, cost-effective, safe, and workable for prevention of malaria among children under 5 years of age in highly susceptible areas with intense seasonal malaria transmission.

The malaria parasite is still the leading cause of morbidity and mortality, causing an estimated 228 million cases of clinical malaria and at least 602,000 deaths in Africa, as of 2021 according to WHO. About 80% of these cases and deaths occur in children under five years old.

In Northeast Nigeria, malaria is endemic, with perennial transmission: the marked seasonal peak runs from July to November each year. This coincides with the onset of the rainy season (June through October) which limits humanitarian relief access and exacerbates the shelter, food, and health situation with direct risks related to sanitation, nutrition, and malaria.

SMC is designed to protect children by clearing existing infections and preventing malaria during the season of greatest risk. This is achieved through the monthly administration of antimalarial medicines, usually sulfadoxine-pyrimethamine plus amodiaquine (SP+AQ), for as long as the rainy season lasts. WHO recommends the SMC as a highly effective, community-based intervention among vulnerable populations.

Following the successful implementation of the pilot cycle of the SMC GIS Tracking Support in October 2021, eHealth Africa (eHA) worked with support from WHO in July 2022, for a state-wide administration of SMC. This time, the exercise covered all 21 Local Government Areas (LGAs) of Adamawa State, and 4 selected LGAs of Yobe State. During the campaign, eHA sought to improve the monitoring of the campaign using GIS Tracking of Community Drugs Distributors (CDD). In addition, they worked to improve accountability during commodity distribution and utilization across the campaign locations.

Training of field staff on the use of the MISTA Tool in Yola, Adamawa state. Photo Credit: eHA

Training of field staff on the use of the MISTA Tool in Yola, Adamawa state.

Photo Credit: eHA

How did we do this?

eHA has in-depth knowledge of the Nigerian terrain, strong partnerships and extensive experience in collaboratively implementing projects across the country including in security-compromised locations. They use this experience in field operations, data management, project logistics, and project management to conduct GIS micro-planning activities, geospatial data analysis and visualization.

To access the hard-to-reach settlements and effectively monitor the campaign and coverage of commodities distributed and utilized, they deployed GIS Tracking throughout the SMC campaign in both states to aid effective and timely monitoring of the movement of over 2,000 teams of Community Drugs Distributors. This enabled real-time information on coverage of households and settlements. The tracking system identified omitted households and provided insight into the areas eligible for mop-up. This also enhanced accountability and transparency during the implementation.

The tracker analyzed and produced daily settlement visitation status and settlement coverage (visited/not visited). In addition, a dashboard was created for both Adamawa and Yobe to monitor drug distribution and utilization during the campaign. 

GIS Tracking proved effective in monitoring SMC campaign activities. It helped to improve accountability during commodity distribution/utilization. eHA remains committed to harnessing technology-driven approaches to eradicate the burden of malaria and other diseases.

CDD Team supervisor, Buhari Bello marks a house after administering SMC in Kofar Arewa Yusufari LGA, Yobe state.

Photo Credit: eHA

eHA Field Officer, Aisha Hussaini (right), retrieving trackers from Ward Focal Persons after SMC field activities in Yola North, Adamawa State.

Photo Credit: eHA

The Program Partners

When GIS and public health experts converged in Geneva

By Chinedu Anarado

On May 9th, the World Health Organization (WHO) formally launched the GIS Centre for Health. The center will manage the production and use of geospatial data and geographic information systems (GIS) towards strengthening public health interventions. Before now, WHO programs and units ran their health data independently. The center will now ensure a dedicated approach to producing and using essential GIS data through the various projects implemented at the center. In addition, it will drive capacity building, partnerships, and collaboration, expansion of GIS infrastructure, and deepening of the geospatial culture within the WHO.

Cross-section of WHO GHFD staff and the GHFD implementing partners (IPs) during the GIS Centre launch in Geneva

eHealth Africa (eHA) participated in this event as a key implementing partner on the Global Health Facility Database (GHFD) project. The GHFD project is one of the projects managed by the GIS Centre. It is also a crucial proof of concept on the value of a center with responsibilities to drive geospatial data generation and usage. The open-access Snakebite and Envenoming Platform is another initiative that leverages support from the GIS Centre, using the latest ArcGIS software. The platform addresses the lack of antivenom in vulnerable communities and improves available information about local snakebite risks.

Screenshot of the Snakebite GIS story map

The database operates as a global reference for anti-venom and snakebite health information. It was established in September 2021 and currently provides snakebite data, risk, nearest health facility for anti-venom etc. The solution is now being expanded to seven countries in East and West Africa, where priority health facilities will be analyzed for accessibility and anti-venom stockpiling. With a GIS-based web mapping, venomous snakes, their distribution ranges, venoms, anti-venoms, and manufacturers of anti-venoms with be available at the click of the button. In the next phase, the database will include data on health facilities and drive time relative to the victim's location. Anyone with internet access can access the platform for information and contribute photos and data to update snake habitats, ranges, and behavior.

The GIS Centre launch was also a gathering of key stakeholders in the GIS, public health, and humanitarian space who identify with the increasing value of geographic information systems (GIS) and the various use cases that will benefit their efforts beyond public health. In addition, we discussed support functions such as data collection tools, GIS usage case studies from the WHO Africa Regional Office, and new GIS features on open data collection kits.

The GIS Centre will leverage WHO's historical experience and knowledge in deploying GIS capabilities in driving public health delivery. Some of these are seen in the distribution of COVID-19, the polio eradication campaign, and the deployment of geospatial maps to support malaria programming.  

eHealth Africa is excited at the prospects of deepening its GIS capacity by partnering with the WHO GIS Centre for Health. Our extensive experience implementing vaccine tracking systems, mapping hard-to-reach localities, supporting immunization campaigns, and microplanning with geospatial maps and data signposts our commitment to using geospatial technologies in public health practice.

The centrality of data in outbreak detection and response: the Data for Action intervention in Kano and Kebbi states

By Chinedu Anarado and Tope Falodun

The world is recovering from the disruptions and losses caused by COVID-19. Nigeria was heavily affected and worked hard to manage the fallout from the outbreak. Using quality data and information was central to these efforts. Daily, the Nigeria Centre for Disease Control (NCDC) published data on those infected and the attendant mortalities. It harvested information from various sources as it worked to control the outbreak. But what if Nigeria had access to quality data at all levels on disease outbreaks? Could it have done better with the COVID-19 outbreak, despite its global dimensions? Perhaps it will have enough information to plan outbreak response and keep people safe.

One of the critical challenges confronting public health management officials is access to quality data to identify, prepare, and respond promptly to potential public health events. This challenge manifests in data illiteracy among relevant officials, inability to aggregate and analyze data, and leveraging analyzed information to take action. There are also data quality issues and the political will to act on the information.  

Participants reviewing data during the Disease Identification USSD training session in Kebbi State

There are many challenges that prevent the regular use of data In Nigeria’s public health sector. For instance, data sources are stored in silos, especially at the generation points. There is no upward information flow where decision-makers can understand what is happening and prepare a response strategy for such an outbreak. For instance, the NCDC has set up Public Health Emergency Operation Centers (PHEOCs) in 23 states. But they are not staffed with the right personnel and tools to analyze information, detect and flag disease outbreaks early enough. They are also not integrated in a manner that gives the NCDC some visibility into what is happening, allowing for easy monitoring and timely response. There aren't enough skills at the generation and perhaps usage points at the local level to clean up, analyze and interpret the data at the primary source.  

Fortunately, eHealth Africa is implementing the Data for Action project to address these issues. The Data for Action effort is a component of the Subnational Emergency Preparedness and Response Capacity Building (SERCB) program, an initiative of the NCDC. The SERCB effort provides an overall emergency preparedness capacity at the state level. Its Data for Action component provides data and information for prompt response action that underpins emergency preparedness. Resolve to Save Lives (RTSL) funds this intervention, which involves delivering solutions for the benefit of the NCDC and state-based Public Health Emergency Operations Center (PHEOCs). Successfully implementing Data for Action will provide data that will support an early warning system, allowing stakeholders to detect and respond to potential disease outbreaks before they assume challenging proportions. The states will also have the critical capacity and resources to sustain the use of data for decision making at the local and sub-national levels. 

eHA has conceived an early warning system that should involve the aggregation and analysis of data. This will cause periodic reporting of identified diseases from the ward unit up to the state level, with a mechanism that shows the reported disease and the frequency of occurrence. It should also define what level of spread and actions to be taken if an outbreak is imminent. 

To arrive at these solutions, we implemented a bottleneck assessment in Kano and Kebbi states that helped us identify the critical challenges preventing the seamless flow of data from the various ward units right up to the state and the center. eHA’s findings from the assessment were addressed by investing in creating data products, building the capacity of disease surveillance and notification officers on data clean up, analysis and presentation. We also trained community informants on disease identification to help improve the sensitivity of surveillance systems. If they can accurately identify diseases, we can report more and ensure that relevant public health actors do not miss potential outbreaks. 

eHA also provided infrastructure and equipment support to ensure the conducive functioning of the PHEOCs. For instance, we operationalized a power generating set in Kano and provided a six-month diesel supply and internet connectivity to support data analysis. In Kebbi state, we provided additional equipment to support communication and visualization, including projectors and screens, public address systems, internet connectivity, air conditioners and water dispensers. Kebbi PHEOC, still at its nascent stage, requires these pieces of equipment to improve their work, and we are glad they are being put to good use.  

In the coming days, we will implement additional training on data use and ensure beneficiaries can produce data products or reports that give insights on the prevalence rate of six priority infections. These include Cholera, COVID-19, Lassa Fever, Measles, Meningitis and Yellow Fever. These diseases are the most prevalent in Kano and Kebbi states. Hence, tracking them will help reduce the prevalence of these outbreaks and the safety of Children. We will back up this effort with periodic supportive supervision to ensure that valuable data is available to ensure decision-makers keep their citizens safe and prevent more disease outbreaks.


Need for Stable and Sustainable Energy for better Healthcare Delivery in Nigeria: A case study of Kano and Osun State Health facilities

By Mohammed Bello

A recent publication by International Renewable Energy Agency (IRENA) stated that around a billion people today rely on health facilities without electricity supply. While most large hospitals may have round-the-clock access to power, electrification rates drop significantly for rural clinics. In the absence of reliable power, many of the basic life-saving interventions cannot be undertaken safely or at all.

Also, a recent study analyzing over 121,000 health facilities, in 46 low and middle-income countries, found that almost 60% of them lacked access to reliable electricity. Even facilities with electricity access can often suffer from an unreliable supply – negatively affecting the ability of medical professionals in rural communities to deliver modern health services.

Renewable energy is at the forefront of solving this issue. Off-grid (stand-alone and mini-grid) renewable energy solutions represent a cost-effective, rapidly deployable, and reliable option to electrify healthcare centers, transforming lives whilst bolstering global efforts to achieve Sustainable Development Goal 3 – good health and wellbeing.

Lack of sufficient and reliable power is jeopardizing the well-being of millions of people, especially women and children, who often bear the brunt of inadequate primary healthcare services. In fact, worldwide, more than 289,000 women die every year from pregnancy- and childbirth-related complications, many of which could be averted with the provision of better lighting and other electricity-dependent medical services (Sustainable Energy For All, 2019).

Like the pilot Energy survey from 10 selected health facilities across seven (7) Local Government Areas (LGAs) of Kano state in August 2020, the expanded phase was also carried out by the Nigerian Energy Support Programme (NESP), a technical assistance programme co-funded by the European Union and the German Government and implemented by the Deutsche Gesellschaft für Internationale Zusammenarbeit (GIZ) GmbH in collaboration with the Federal Ministry of Power (FMP), in partnership with eHealth Africa. It was conducted in close cooperation with geospatial data experts from INTEGRATION Environment & Energy GmbH (INTee) and Reiner Lemoine Institut (RLI) in Germany. This is part of the effort of the NigeriaSE4ALL Initiative to offer the most up-to-date, ground-truth, electrification data available in Nigeria.

The expanded survey was also carried out using a remote interview method for conducting interviews with the health facility in-charges in selected health facilities across 43 out of 44 LGAs of Kano, and 27 out of 30 LGAs of Osun state.

The findings from the result of the earlier concluded pilot survey necessitated the expansion in the scope of the survey, to gather sufficient information that would help provide a bigger picture of the energy needs, current situation, and guidance for the planning of possible implementation of suitable energy solutions for communities. The expanded scope covered a total of 291 health facilities - 173 health facilities in Kano state and 118 health facilities in Osun state.


.

Helpdesk Agents administering questionnaires remotely to Health Facility In-charges in Kano and Osun State

Helpdesk Agents administering questionnaires remotely to Health Facility In-charges in Kano and Osun State

The methodology used in collecting the data is through remote administration of survey questionnaires via phone calls, to ensure adherence to and support the COVID-19 response efforts in Nigeria and minimize the risk of infection through physical contact.

The primary aim is to assess energy gaps and identify the potentials for connection to an off-grid power source (renewable energy) and at the same time, determine the readiness for Covid-19 response at the Primary Health facility level.

The diagram below presents a summary of the implementation approach adopted for the survey.

Figure:  Summary of the implementation approach adopted for the survey.

Figure: Summary of the implementation approach adopted for the survey.

  • The following four major data sources were utilized; 

    • list of health facilities extracted from the eHA data portal, 

    • Grid Clusters (potential location for off-grid infrastructure),

    • Senatorial administrative boundary

    • Contact list for Health Facility representatives

Health facility data and senatorial administrative boundaries were downloaded from the eHA Data portal/ GRID3 as shapefile format, power grid location was downloaded from Nigeria SE4ALL Webmap; in Geojson format, containing the KEDCO - Grid Data MV Lines (2016) and Osun state MV power lines. 

Finally, a structured survey was designed to capture the energy required capabilities and capacity of the health facilities.

Fig 2. Map showing the distribution of Primary health facilities in Osun state(Left) and Kano state(Right)

Fig 2. Map showing the distribution of Primary health facilities in Osun state(Left) and Kano state(Right)

Screenshot 2021-06-02 164425.png

Activities

Remote administration of questionnaires to the health facilities in-charges via phone calls to identify the following:

  • the health centers’ current electricity supply status

  • general services provided by the health centers, 

  • their current ability to cope with the COVID-19 response

  • available infrastructure at the health center that would impact considerations around power requirements

Key Findings

  • The survey findings indicate that all infrastructures do not meet up the minimal requirement stated by NPHCDA and some health services needed to be upgraded

  • Power shortages affect the functionality of many types of equipment at the health centers across all assessed facilities thereby, affecting the output and overall performance of the facilities in terms of service delivery.

Benefits of the survey

The outcome of the survey provides visibility on areas and health facilities that require urgent intervention, such as the provision of PPEs to the health facilities and other equipment/infrastructures. Also, the data collected were subsequently published with updated health facilities infrastructure and services information on the eHA data portal for public access and to all for non-commercial use.

Finally, the survey makes readily available information relating to health facilities and the preventive measures taken during the COVID-19 crisis.

Future Survey Use Case Potential:

The remote survey showcased the capacity to effectively gather information on energy sources and requirements whilst supporting efforts in preventing the spread of the COVID-19 virus, without requiring a face-to-face engagement. 

Considering the necessity for energy supply, especially at health facilities, these surveys present a clear understanding of current energy systems that may not be sustainable and the need to consider alternative sustainable energy systems that would have minimal impact on climate change and make lives better.

Ultimately, surveys can be conducted nationwide to establish a baseline for the energy requirements of Primary Healthcare facilities.

It is evident that the functionality and efficiency of the Nigerian health systems especially in rural settings, can not be optimized with the use of on-grid electricity, some components of which are affected by unstable weather due to climate change. As such, harnessing renewable energy will be an alternative way of addressing the persistent power challenges in the health sector.

The Program Partners

eHealth Africa’s Ifeanyi Franklin Ike, named one of the 50 rising stars in the geospatial Industry

By Oladipo O. Olurishe

Franklin, a GIS Coordinator here at eHealth Africa (eHA) has been recognized as a rising star to look out for in the geospatial industry the inaugural Geospatial World 50 Rising Star list published by Geospatial Media. We are excited to congratulate Ifeanyi Franklin Ike on this accomplishment. We had a brief chat with Ifeanyi about this accomplishment.

Ifeanyi Franklin Ike

Ifeanyi Franklin Ike

You were recently listed among the 50 rising stars to look out for in 2021 on the geospatial media, how does that make you feel?

This recognition comes as a bit of a surprise to me that out of all nominated young persons in the geospatial world, my contribution to the geospatial industry in Nigeria has been appreciated. It makes me feel excited and zealous to do even more. This could have come at no better time than now, when fatigue was already setting in for the work done for Nigeria’s COVID-19 response. I feel more energized to contribute more. 

Since last year, Ifeanyi has been working closely with the Nigeria Centre for Disease Control (NCDC)  to provide geospatial and data solutions to support the country’s response to the COVID-19 pandemic. He is a member of the multi-partner team that developed an assessment tool for checking health care workers' preparedness for COVID-19 response. Ifeanyi also designed the web and mobile geospatial analytics tools for tracking COVID-19 outbreak in the country. He also designed the data collection platform for the First Few Cases of COVID-19 (FFX) study in Nigeria and the dashboard for the COVID-19 Personal Protective Equipment (PPE) distribution in Nigeria.,

Can you tell us what geospatial data is and what the geospatial industry is all about?

In the first place, data is a set of information that has been translated into a form that can be processed. Geospatial data can then be said to represent the sets of data that are linked to specific/known locations in space (the world). 

Over the recent years, the geospatial industry has grown beyond imagination with potential for more growth. In our world of today, the application of location-intelligent (geospatial) algorithms in our daily engagements have developed drastically. So it is safe to say that the geospatial world is the backbone of most modern technological developments and will continue to do so in the unforeseeable future.

Can you tell us about your work, what you do around geospatial data?

I’m a data scientist with a special interest in geospatial data analysis, especially as it relates to the Global Health Informatics Strategy (GHIS). I employ insightful location-based analysis in creating solutions that help to support effective data-driven decision-making, especially in the public health sector. This passion for creating public health solutions using geospatial data was and remains my motivation for joining eHA.

What impact can you say your work has had by using geospatial data?

My work using geospatial data has positively impacted the Public Health space.  My use of geospatial data has supported the design of solutions that are geolocation-centric, bringing out varieties of insightful information which have supported public health decision-making across different organizations.

Some examples include contributing to the designing of the following tools:

  • eHA's PlanFeld application geodatabase

  • The vaccine delivery optimization tool for eHA

  • Sampling scripts for the National Micronutrient and Food Consumption survey in Nigeria

  • M&E tools for the tracking of World Bank COVID-19 grants to support IAP implementation in States

What is the future of geospatial data? How will it help the world solve problems?

As I mentioned earlier, geospatial data, geospatial technologies, and geospatial skillset forms the backbone of modern technological developments and will continue to do so in the next unforeseeable part of the future. With the global shift away from the era of the industrial revolution to the information age and the continuous increase in the need for location intelligent applications in our day-to-day endeavors, the future is very bright for the geospatial industry. I’m therefore excited to belong to the geospatial family of this generation and thankful to all my colleagues at eHA for the wonderful geospatial work we are doing together.

Let’s keep pushing. Thank you

Congratulations once again to Franklin,  continue the outstanding work you are doing in the geospatial industry.

Remote Assessment of Energy Gaps in Selected Health Facilities in Kano State: Identifying Potential for Alternative Energy Sources

In accordance with the standard for operations in most health centers, The World Health Organization (WHO)1 states that the majority of health centers require energy for water supply, temperature control, lighting, ventilation, and clinical processes. In terms of electricity, Nigeria is ranked by the World Bank as the second country in the world and the first in Sub-Saharan Africa with more of her population not having access to electricity. With a population of about 200 million Nigerians, over 80 million representing 40% of the country’s population, lack access to grid electricity2. Presently, power generation, transmission, and distribution rates are not commensurate with the energy demands of the population, giving rise to consumers depending on dirty and outdated energy sources that have adverse health and economic consequences on them and the society at large. Nigeria’s energy demand was estimated to rise to 88,282MW by 2020 from 15,730MW in 20163 . Despite the country’s current installed generation capacity of 12,522MW, it generates an average of 4,500 MW, which is transmitted through its fragile National Grid and is grossly insufficient to meet the electricity demand of its 190 million population not excluding demands at health facilities.

Sadly, only an estimated 30% of Nigerians are connected to the national grid. This low and erratic power supply affects the community’s primary health centers forcing the management to rely on kerosene lanterns as a source of lighting and petrol generator as their primary source of electricity (UNDP Nigeria., 2015)4. As a result, this hinders the efficiency of health services and amenities for optimal operation.

To improve service delivery dependent on energy supply, there is a need to identify the gaps in energy sources of primary health centers in relation to needs/consumption. To this end, a pilot survey was carried out by Nigerian Energy Support Programme (NESP), a technical assistance programme co-funded by the European Union and the German Government and implemented by the Deutsche Gesellschaft fürInternationaleZusammenarbeit (GIZ) GmbH in collaboration with the Federal Ministry of Power (FMP), in partnership with eHealth Africa. It was conducted in close cooperation with geospatial data experts from INTEGRATION Environment & Energy GmbH (INTee) and Reiner Lemoine Institut (RLI) in Germany. This is in line with the objectives of the SE4ALL initiative that are working globally to ensure universal access to modern energy services; doubling the global rate of improvement in energy efficiency, and doubling the share of renewable energy in the global energy mix by 2030 compared to 2010.

Due to the current pandemic (COVID-19) situation of the world and the country Nigeria, the pilot was geared at finding out how effective remote surveys can be applied to gather data required to understand and make decisions on energy challenges at health facilities. It was pertinent to adhere to all precautionary measures to prevent the further spread of the virus during an actual physical face-to-face survey. Hence, this survey employs a remote data collection approach in administering questionnaires, as an alternative to the conventional physical data collection.

Helpdesk Agent administering questionnaires remotely to Health Facility In-charges in Kano State

Helpdesk Agent administering questionnaires remotely to Health Facility In-charges in Kano State

In this respect, eHealth Africa (eHA), a leader in the use of technology, data-driven approach plus in-country expertise in public health-focused activities in partnership with NESP having expertise in alternative energy research, conducted a Pilot Survey on selected Primary Health Centers in Kano State with the aim of assessing energy gaps and identifying potentials for connecting to an off-grid power source (renewable energy) and at the same time, their readiness for Covid-19 response at the primary facility level. 

For the purpose of this survey, five major sources of data have been employed which include; health facilities extracted from the eHA data portal, Grid Clusters (potential location for off-grid infrastructure), population figures, senatorial administrative locations, and structural survey questionnaires. Health facility data and senatorial administrative boundaries were downloaded in shapefile format from the data portal published by eHealth Africa, grid cluster was provided by NESP  (containing the cluster of buildings), population information was downloaded from VTS portal in raster format. Finally, a structure of the survey was designed to capture the energy required capabilities and capacity of the health facilities.

A four grouped structure survey form was designed. The first group was basic information from the respondent (8 questions), the second group was infrastructure equipment at the health center (6 questions), the third group was about services rendered by the health facilities (5 questions) and the fourth group was on energy sources at the health facility (12 questions).

Figure: 2.1Map showing the distribution of sample clusters and health facilities

Figure: 2.1Map showing the distribution of sample clusters and health facilities

A systematic snowball sampling survey technique was used through a phone call to the health facilities. Since the health facilities were predetermined and a focal person was also identified at each of the health facilities, which made the survey straight forward. Also, the collection process was digitized to an ODK web form.

Key Activities

eHA’s Program and GIS team worked with INTee to analyze remotely mapped clusters for suitability with mini-grid. At the initial phase, INTee shortlisted 30 locations for the survey and handed over the longlist to eHA, to come up with a shortlist of 10 health facilities preferably PHCs, using agreed criteria as highlighted below. The LGAs selected fell within the 3 senatorial zones of Kano  (Sumaila, Bagwai, Gabasawa, Kibiya, Karaye, Minjibir, and Tudun Wada).

  • Their electrification status (off-grid and on-grid) and already mapped in OpenStreetMap by NESP

  • The health center should be close to a settlement

  • The health center should be located where there are nearby  buildings

  • The locations and health centers should be within Kano state

    After shortlisting the facilities, a list of community leaders and health facilities in charge were generated along with their contacts for the purpose of conducting a remote interview with them. This is aimed at identifying the gaps within the community and the health facility with respect to their electrification status. 

    The survey sought to assess general information on the health center services and equipment,  and how this relates to their power requirements and current electrification status.  Their current ability to cope with the COVID-19 response were also accessed. eHA administered questionnaires to each of the shortlisted health facilities to identify their current energy needs. Daily calls were made from the call helpdesk to administer the questionnaire and individual responses were captured accordingly. The completed questionnaires were then uploaded to the KoBo Toolbox platform for analysis. NESP was responsible for conducting the analysis.

    To ensure a community-based perspective was covered, community leaders where the health centers were located were also interviewed. Questionnaires were also administered in a similar remote fashion. To capture the appropriate responses,  the local language was used to administer these questionnaires, and the feedback generated were also uploaded to the KoBo Toolbox for analysis purposes.

    Key success

    The remote survey showcased the capacity to effectively gather information on energy sources and requirements whilst supporting efforts in preventing the spread of the COVID-19 virus.

    It also increased the availability of information related to health facilities and the preventive measures taken during the COVID-19 crisis.

    Beyond the energy needs, the analysis from data gathered during the survey showed that available infrastructures at the facilities do not meet up with the minimum requirements stated by NPHCDA. Some gaps in health services provision were identified and needed to be bridged. Furthermore, power shortages at the health centers across all primary health facilities were a common occurrence. All these were achieved via a remote survey which ensures a zero level of risk faced by data collectors.

The Program Partners

Screen Shot 2021-03-16 at 12.15.26 PM.png

Sustaining the Push: Essentials for Attaining a Polio-free Nigeria

Children at a school in Kogi State receive the Oral Polio Vaccine during an Immunization Plus Days (IPD) activity

Children at a school in Kogi State receive the Oral Polio Vaccine during an Immunization Plus Days (IPD) activity

Today, June 19, 2020, the World Health Organization (WHO) declared Nigeria, polio-free.

The first requirement for attaining the polio-free certification—no wild poliovirus transmission for three consecutive years—was attained on August 21, 2019  1.

The Africa Regional Certification Committee’s visit to Borno State in March 2020 as part of the process for certifying Nigeria polio-free

The Africa Regional Certification Committee’s visit to Borno State in March 2020 as part of the process for certifying Nigeria polio-free

This success is the result of several sustained efforts, including domestic and international financing, the commitment of thousands of health workers and the switch to electronic, technology-driven data collection and management systems which have given decision-makers and polio eradication partners the accurate data needed to develop plans and strategies for reaching every eligible child, even in hard-to-reach and security-challenged areas 2.

Having achieved the milestones of primary requirements, the ARCC will first review the complete documentation report of the interruption of wild poliovirus type 1 and then proceed to conduct field verification visits to select states in the south of Nigeria. If the ARCC is satisfied with the national documentation and field verification after both visits in December 2019 and March 2020, the WHO African Region could be certified to have eradicated polio by mid-2020.
— Dr. Fiona Braka, WHO Nigeria Team Lead, Expanded Programme on Immunization (EPI)

eHealth Africa supported these efforts by providing Geographic Information Systems-based solutions and services including the Vaccination Tracking System (VTS). Here is how states benefited :

  • eHA supported states to develop a comprehensive, up-to-date list of settlements. 

In 2014 and 2015, eHA mapped the eleven northern states under the Global Polio Eradication Initiative (GPEI). The data proved so useful to decision-makers that eHA received funding from the Bill and Melinda Gates Foundation (BMGF) teamed up with the National Primary Health Care Development Agency (NPHCDA), the UK Department for International Development (DFID), Flowminder, the United Nations Population Fund (UNFPA) and the Center for International Earth Science Information Network (CIESIN) to map the rest of Nigeria during the Geo-Referenced Infrastructure and Demographic Data for Development (GRID3) project which lasted from 2017 to 2019. We also frequently execute data collection and campaign activities across the country during which we gather spatial and non-spatial data relating to several points of interest including settlements and health facilities. These data are housed in what we call the eHA Geodatabase (GDB). 

Using the datasets in the GDB, we have helped states in Nigeria to identify previously unknown settlements and update their master list of settlements. eHA developed and provided the states updated LGA and ward level maps. The maps include the geocoordinates, names, and delineated boundaries of known and newly identified settlements. These updated master list of settlements and the new maps allow health planners to develop accurate, comprehensive micro plans for Routine and Supplementary Immunization Activities and reach eligible children in the remotest communities.

The Vaccinator Tracking System dashboard

  • eHA built the capacity of health teams at the state and local government levels to visualize and analyze vaccination coverage data for decision making during campaigns.

Through the VTS dashboard decision-makers, partners, and other stakeholders can access near real-time information about ongoing and concluded immunization campaigns such as the immunization coverage and missed settlements. eHA trained health teams at the state and LGA levels to easily access, visualize and analyze the data on the dashboard, and use it to promptly identify and address challenges that may affect the immunization coverage levels in the state. 

The milestones recorded by Nigeria’s Polio Eradication program prove without a doubt, the positive outcomes that are possible when decision-makers use quality data as the basis for planning and implementing projects. eHealth Africa is proud to be a part of Nigeria’s Polio success story. We thank and congratulate our partner organizations and governments at the national and sub-national levels, who were all instrumental in this achievement.

Going forward, we know that a strong immunization program is essential to sustain this success so, we continue to support immunization programs at the state and national levels through projects such as Vaccine Direct Delivery, LoMIS Stock, and Kano Connect.

The Strides of Polio Vaccination in Hard to Reach Areas (HTRs) in Borno State

By John Momoh

As Nigeria marks 3 years and 10 months without a new wild poliovirus case, here is how the program has contributed to the Polio Eradication initiative in Borno State since 2016:

Borno blog infogrphic-01.png

Inaccessibility to some settlements in  North East, Nigeria presents a great challenge to the immunization program in states like Adamawa, Borno, and Yobe states where the ongoing conflict is most severe. Health facilities in these states have been destroyed leading to a reduced number of eligible children being reached with Routine Immunization (RI) services. The mass displacement of people, migration from settlements, and insecurity have all hindered the planning and execution of Supplementary Immunization Activities (SIAs) such as Immunization Plus Days (IPDs) and Outbreak Response (OBR) campaigns in the region.

A child receives his vaccination at a settlement in Maiduguri, Borno state during an IPD campaign

A child receives his vaccination at a settlement in Maiduguri, Borno state during an IPD campaign

In 2016, after a wild poliovirus outbreak in Borno, the  Borno State Primary Health Care Development Agency (BSPHCDA), in close collaboration with World Health Organization (WHO), the Bill and Melinda Gates Foundation (BMGF), U.S Centers for Disease Control and Prevention (CDC), United Nations Children’s Fund (UNICEF), eHealth Africa (eHA), Solina Health and other partners, launched the Reach Every Settlement (RES) and the Reaching Inaccessible Children (RIC) to access under-5 children in partially Hard to Reach (HTR) and HTR settlements respectively in order to interrupt the transmission of the virus.

Polio eradication partners at a working group meeting

Polio eradication partners at a working group meeting

eHealth Africa has been supporting the projects by leveraging our expertise in Geographic Information Systems, field operations, and logistics to collect and analyze geospatial data to aid near real-time monitoring of the program and decision-making by the state and relevant key stakeholders.

Pushing the Boundaries of Routine Immunization coverage

By John Momoh & Emerald Awa-Agwu

In 2017, following the results of the 2016-2017 Multiple Indicator Cluster Survey/ National Immunization Coverage Survey (MICS/NICS) Report, which put Nigeria’s routine immunization (RI) coverage rate at 33%,  the National Primary Health Care Development Agency (NPHCDA) declared a state of emergency on RI in Nigeria 1. This led to the establishment of the National Emergency Routine Immunization Coordination Centre (NERRIC) and its state-level counterparts, across the 36 states of the federation. NERICC and SERICC targeted states and local government areas that had low immunization coverage rates with various interventions, aimed at attaining a RI coverage rate of 84% by 2028. The majority of states in this category are in Northern Nigeria 2

Many reasons exist for low vaccination coverage rate including non-compliance by households, insufficient vaccines, health workers, and/or health facilities to meet the demand for immunization services. However, what happens when you have all these factors combined with insecurity, displacement of people, and physical destruction of health facilities?

eHA consultant in Magumeri LGA training the LGA RIE team on the use of electronic data collection methods

eHA consultant in Magumeri LGA training the LGA RIE team on the use of electronic data collection methods

It’s an Emergency
The insurgency in Northeast Nigeria has been ongoing since 2009 and the current reality is that health workers and households face grave challenges delivering and accessing RI services. There are issues of security to consider as well as the migration/abandonment of settlements which hinder proper planning and execution of routine and supplementary immunization activities (SIAs). This has led to consistently underserved populations and thus, low immunization coverage rates.

eHA consultant in Biu LGA supporting the LGA RI Officer to micro-plan using GIS Maps

eHA consultant in Biu LGA supporting the LGA RI Officer to micro-plan using GIS Maps

The Strategy
To alleviate this, the Borno State Emergency Routine Immunization Coordination Centre, in close collaboration with partners including the World Health Organization (WHO), Rotary International, the U.S. Centers for Disease Control and Prevention (CDC), the United Nations Children’s Fund (UNICEF), the Bill & Melinda Gates Foundation (BMGF), eHealth Africa (eHA), Solina Health, and Novel-T launched the Routine Immunization Expansion (RIE) strategy to expand RI activities to security-challenged areas in order to improve the coverage rates. This strategy uses Geographic Information Systems (GIS) solutions as the basis to identify and target settlements for RI sessions and provide proof of visitation, thereby, improving routine immunization coverage.

eHealth Africa's Role
We have leveraged our expertise in data management solutions and Geographic Information Systems (GIS), to provide end-to-end support for the implementation of the RIE strategy in Borno. We provide the RI teams with up-to-date GIS maps and a list of settlements that they use during their microplanning activity to estimate target populations and allocate catchment areas to health facilities across the state. Using these tools and local knowledge, the teams prioritize and plan what areas to reach using criteria like accessibility, habitation status, and the proximity to adjoining settlements. Furthermore, this allows each LGA to estimate the optimal number of teams and days required to cover all their targeted settlements for each round of RIE implementation. This process is critical to the program because it has a direct impact on logistics and finance planning. During RIE field implementation activities, we monitor RI teams’ coverage in security-compromised areas using GPS-enabled Android phones, similar to what occurs in the Vaccinator Tracking System project.

At the end of each round, we develop a post-implementation report and updated map which are shared with the relevant stakeholders for informed decision-making and progress monitoring.

The Progress So Far

image2.png

As a result of using GIS technology, routine immunization coverage in security-challenged areas in Borno has increased from 12% in April 2019 to 88% in December 2019.

image1.png

These results show the significant impact that innovative data solutions and GIS technology, combined with contextual insight and partnership can have on health interventions in low-resource settings.

Using Geospatial Technology to Improve Vaccination Coverage Rates: A Case Study of Ganjuwa LGA, Bauchi State

By Fatima Mohammed

IMG_20191204_095328.jpg

In May 2012, Nigeria and 193 other member states of the World Health Assembly endorsed the Global Vaccine Action Plan (GVAP), a strategy to launch the “Decade of Vaccines” during which millions of deaths would be prevented through more equitable access to vaccines, by 2020. Two important targets of this plan were that all 194 countries should attain a national coverage of 90% and 80% in every district or equivalent administrative unit, for all vaccines.

Since the launch of the plan, the National Program on Immunization (NPI) led by the National Primary Health Care Development Agency (NPHCDA), has made great efforts to increase the immunization coverage rate in Nigeria. Immunization is a top priority for decision-makers and they have collaborated with partner organizations to develop strategies to strengthen the delivery and demand for Routine Immunization (RI) and Supplementary Immunization Activities (SIAs). As a result, more children have been vaccinated than ever before1. However, Nigeria is still ranked as one of the countries with the lowest immunization coverage rates globally2. Several factors such as the insurgency in the Northeast, and cultural perceptions and beliefs leading to non-compliance and drop-out rates, have contributed to this but a major challenge has been the lack of an accurate denominator.

A child getting vaccinated during a vaccination campaign in Kogi State

A child getting vaccinated during a vaccination campaign in Kogi State

What is a denominator?

A denominator usually refers to the total estimated number of eligible individuals in a population or the total estimated number of people in a target population3, 4. When delivering immunization services, health personnel develop micro plans to ensure that immunization services reach every community5. Micro-plans are used to identify priority communities, determine denominators/ eligible individuals, identify barriers and develop work plans for deploying solutions to those barriers6. Denominators are essential during the microplanning process to make sure that eligible people are not left out.  If health workers and administrators are unaware of a community’s existence, that community may be left out of micro-plans, denying eligible children the vaccines that they need. This will, in turn, reduce herd immunity in the state and eventually in the country, even though high immunization coverage rates are recorded.

An ongoing microplanning activity

An ongoing microplanning activity

For the past decade, eHealth Africa has worked with partners to support the National Program on Immunization and increasing the capacity of health systems to deliver quality health services, especially in underserved communities. eHA designs and deploys data-driven solutions and interventions that leverage Geographic Information Systems (GIS) technology, to identify and map settlements within the remotest communities, so that health workers can develop accurate, comprehensive micro-plans, to better plan and monitor health interventions.

A Data Collector collecting settlement data in Bauchi State

A Data Collector collecting settlement data in Bauchi State

Through the Vaccinator Tracking Systems (VTS) project, we track the movement of vaccinators during SIAs to identify missed settlements and ensure that these settlements and their target population are reached, achieving a wider immunization coverage. Having mapped all the 36 states of Nigeria through the Geo-Referenced Infrastructure and Demographic Data for Development (GRID3) project, we provide up to date maps to states based on an accurate database of settlements and communities in  Nigeria, enabling our partner states to plan more efficiently. 

Case Study: Ganjuwa Local Government Area in Bauchi State

The Bauchi state master list of settlements contains 1,134 settlements for Ganjuwa Local Government Area (LGA). The planning for all interventions and projects in the state is based on this number. However, the eHealth Africa geodatabase has a list of 2,817 settlements for the same LGA, implying that almost 60% of the settlements in the LGA are left out during the microplanning process and consequently, during polio campaigns. Whenever eHA conducted the vaccinator tracking exercise based on the list on our geodatabase, the LGA perpetually fell below the target coverage rates.

To address this, eHA planned and conducted a “Hamlet Buster” activity to identify and rename the missed settlements in Ganjuwa LGA, in December 2019. The LGA had 2,051 machine-named settlements according to our geodatabase, the highest ever recorded in Nigeria.  Machine-named settlements occur when geospatial data collection tools pick up on features that are indicative of hamlet areas or small settlement areas. During a hamlet buster activity, field data collectors trace and visit these settlements using their geocoordinates, determine their name and accurate boundaries, and update them on the geodatabase. 

At the end of the hamlet buster activity in Ganjuwa, 1984 0f 2051 machine-named settlements were visited and renamed. This data will help to achieve the following in Bauchi State:

  • Improve healthcare provision planning and Monitoring by updating the existing micro plans

  • Harmonize the LGA/State master list of settlements with eHA’s geodatabase list

  • Create more accurate health facility catchment area maps and targets for Routine Immunization and other interventions

This work will help the state to achieve great milestones in health delivery because the data will not only be used for immunization but for other programs. It will make our planning for future activities easier and more realistic. The state is very grateful to eHealth Africa for this because we now have an authentic microplan. eHealth Africa also helped us to transit from paper-based to digital micro plans.
— Bakoji Ahmed State Immunization Officer, Bauchi State.

Supporting Access to Immunization through Supplementary Immunization Activities

By Abubakar Shehu and Emerald Awa- Agwu

Supplementary Immunization Activities (SIAs) are one of the four strategies put forward by the Global Polio Eradication Initiative (GPEI) in 1988. In Nigeria, SIAs include Immunization Plus Days (IPDs), Outbreak Responses (OBRs) and other immunization outreaches conducted by the Nigerian government and its polio eradication partners. The aim of SIAs is to interrupt the transmission of the poliovirus by immunizing all children under five years of age with two doses of oral polio vaccine irrespective of their previous immunization status—unimmunized, partially covered or fully immunized.

A child receiving the Oral Polio Vaccine

A child receiving the Oral Polio Vaccine

SIAs are intended to complement Routine Immunization. However, in some areas, they represent the major strategy for catching unimmunized children and ensuring that they are vaccinated against polio and other vaccine-preventable diseases. Access to routine immunization services may be hindered for a variety of reasons including:

  • Challenges with cold chain equipment leading to vaccine damage and loss of potency, and eventually, unavailability of vaccines. Caregivers are often reluctant to return to health facilities where vaccines were unavailable. This results in missed opportunities to commence or complete the vaccination course.

  • Security challenges that make health facilities hard to reach by caregivers who bring children for immunization.

  • Access-related challenges such as caregivers having to travel long distances to the health facility or being unable to afford the cost of transportation

  • Wrong myths or perceptions about vaccinations such as loss of fertility as a result of vaccination.

SIAs take immunization services directly to children at their doorsteps, thereby bridging any gaps that may result from an inability to access vaccines at the health facilities. By achieving a vaccination coverage of at least 80% (that is, by vaccinating at least 80% of the targeted children with a potent vaccine), herd immunity can be achieved and the poliovirus can be deprived of the susceptible hosts which it needs to survive.

Through Supplementary Immunization Activities, children who were missed by routine immunization services can be reached with life-saving vaccines

Through Supplementary Immunization Activities, children who were missed by routine immunization services can be reached with life-saving vaccines

Prior to 2012, Nigeria had been conducting SIAs but was still recording cases of wild poliovirus (WPV). After a holistic examination of the immunization program, it was discovered that there was a huge disparity between the actual versus reported immunization coverage. Reports from independent monitoring and supervision groups showed that the actual vaccination coverage of the SIAs was much lower than the reported coverage. There were many missed settlements and an even larger number of missed children. It was discovered that some vaccination teams never visited the communities, instead, they would discard the vaccines and record false information in the tally sheets to account for the empty vials. Not only was this frustrating the polio eradication efforts, but it was also causing the health system huge losses as a result of the wasted vaccines.

It became imperative to develop a methodology to improve vaccination coverage and ensure that the vaccination teams visited all the target settlements during SIAs. This led to the development and deployment of the Vaccination Tracking System (VTS) in 2012.

VTS provides healthcare administrators and partners in the polio eradication space with daily insight into the activities of vaccination teams during SIAs by collecting passive tracks of the vaccination teams using Geographic Information Systems (GIS technology-enabled android phones and uploading them onto a dashboard for visualization. This provides stakeholders with near-live data about the geo-coverage of the vaccination campaign. The system also identifies missed settlements on a daily basis so that immediate action can be taken and the settlements can be included in the ongoing campaign. Another benefit of the VTS is that it increases the accountability of vaccination teams because the vaccinators know that they are under constant supervision. This greatly reduces the risk of data falsification.

The VTS dashboard provides decision-makers with near-real-time data about the progress of immunization campaigns and outreaches

The VTS dashboard provides decision-makers with near-real-time data about the progress of immunization campaigns and outreaches

So far, VTS has been used to track 82 supplementary immunization activities in 30 states of Nigeria. A significant proportion of these states have seen an exponential increase in the vaccination geo-coverage rates from the first campaign tracked to the last tracked campaign.

Increase in vaccination coverage rates

Increase in vaccination coverage rates

VTS makes sure that eligible children who, for any reason, are unable to receive their vaccinations through the routine immunization sessions at the health facilities, have a second chance to be protected against vaccine-preventable diseases like Polio and Meningitis.

Strengthening Routine Immunization using Lessons learned from Polio Emergency Support

By Joshua Ozugbakun & Emerald Awa-Agwu

In July 2016, after over two years of being polio-free, two wild poliovirus cases were discovered in Borno State, Nigeria. This launched fresh efforts to strengthen the four pillars of polio eradication including Routine Immunization (RI), Supplementary immunization activities (SIAs) (including national Immunization Plus Days (IPDs)), Surveillance and targeted mop-up campaigns.

A health worker vaccinates a child with the Oral Polio Vaccine

A health worker vaccinates a child with the Oral Polio Vaccine

Partners, both local and international, collaborated with the Nigerian government at state and national level, through various interventions and projects to increase the coverage and effectiveness of IPDs and mop-up campaigns in order to increase herd immunity and stop polio transmission, especially in high-risk states like Adamawa, Borno and Yobe states. These interventions were coordinated by the State Emergency Routine Immunization Coordination Centers (SERICCs). Each SERICC is led by individual state governments and help to improve information sharing, joint programming of public health emergency management activities (planning, implementation, monitoring, and evaluation) with partners. The National Emergency Routine Immunization Coordination Center (NERICC) is responsible for strategy development and oversees the activities of all the SERICCs. With this coordination mechanism in place, the menace of polio is being tackled collaboratively and Nigeria is well underway to being declared ‘Polio Free’, a major milestone in its vaccine-preventable disease management efforts.
A major takeaway for Nigerian polio eradication stakeholders after years of battling polio is the need for data collection, management and storage systems to be upgraded. As the need to halt poliovirus transmission increased, it became increasingly obvious that paper-based data management systems were incapable of providing decision makers with the reliable, actionable data which they needed for effective programming. eHealth Africa responded to this challenge by supporting states across Nigeria to develop comprehensive, digital maps using our expertise in Geographic Information Systems (GIS). The accuracy of these maps improves the microplanning process and guarantees a greater coverage of settlements during campaigns.

Our GIS technology has improved the quality of maps used for polio campaign planning

Our GIS technology has improved the quality of maps used for polio campaign planning

In addition, through our Vaccinator Tracking Systems (VTS) project, GIS-encoded Android phones are used to record and store passive tracks of vaccinators as they conduct their house-to-house visits; allowing decision-makers to have an accurate picture of the settlements that have been covered during IPDS and mop-up campaigns. This data can easily be accessed through dashboards for a more detailed analysis and breakdown of coverage information.


Supporting polio emergency response activities also highlighted the need for the Nigerian health system to move from an emphasis on SIAs and campaigns to strengthening the RI and disease surveillance systems. Sound routine immunization and disease surveillance systems are necessary to sustain the herd immunity built through polio campaigns.

In Kano state, the LoMIS Stock solution helps the State Primary Health Care Management Board to ensure that the vaccine supply chain is maintained. Health workers at the facility level use the LoMIS Stock application to send reports on a variety of vaccine stock indicators including vaccine utilization, vaccine potency, stock levels, wastage rates, and cold chain equipment status. Supervisors access the reports through the LoMIS Stock dashboard and are able to respond appropriately. This ensures that the RI system is maintained and that health facilities are never out of stock.

In the past, Acute Flaccid Paralysis (AFP) surveillance in health systems across Africa was passive. This meant that disease surveillance and notification officers (DSNOs) only reported or investigated suspected AFP cases that were presented at the health facility. According to the U.S Centers for Disease Control and Prevention (CDC)1, over 72% of polio cases are asymptomatic and as such, will not present at the health facility. In addition, DSNOs are unable to visit every single community to actively search for AFP cases due to logistics and security challenges. Relying on data from passive AFP surveillance causes programs to be designed based on data that excludes the asymptomatic polio cases. Auto-Visual AFP Detection and Reporting (AVADAR) reduces the burden on the DSNOs by enlisting members of the community to actively find AFP cases and report using a mobile application on a weekly basis; thus, providing accurate real-time surveillance data that can be used for program planning and implementation.

An often overlooked factor that promoted the transmission of the poliovirus was the rejection of the polio vaccine by mothers and households due to various myths and socio-cultural barriers. By engaging traditional and religious leaders as ambassadors of vaccination, more mothers and households are accepting the polio virus.

The central lesson in Nigeria’s journey so far towards polio eradication is the importance of collaboration and engagement at all levels including communities. eHealth Africa is proud to be supporting governments and health systems across Africa to respond to the polio emergency.

Fighting Cholera with the Power of Geospatial Mapping

By Ayodele Adeyemo & Hawa Kombian

The Cholera Threat

According to the World Health Organization (WHO), cholera (an infectious disease which causes acute watery diarrhea) remains a global threat to public health with an annual average of 82,000 deaths. In Nigeria, the cholera burden has been an average of 10,000 cases annually with over 70% of the cases coming from Bauchi, Yobe, and Zamfara states.

Following the review and recent publication of WHO guidelines on cholera control, the Nigeria Centre for Disease Control (NCDC) has begun the implementation of innovative approaches to tackle cholera via:

  • Strengthening disease surveillance for early detection and quick response through innovative use of technology and data.

  • Improving coordination for technical support, resource mobilization, and partnership.

  • Adopting a multi-sectoral approach to meet the 2030 cholera elimination by working with the environment and Water and Sanitary Hygiene sectors to ensure that communities have good water and sanitary facilities which will prevent further outbreaks

The Digital Health Advantage

What does an innovative model for cholera prevention and control look like?

In 1854, John Snow mapped out the cholera deaths during an outbreak and observed that they all occurred within short distances and were clustered around the Broad Street pump. He went ahead to carry out statistical tests to illustrate the connection between the source of water and the cholera cases.

In synergistic partnership, NCDC and eHealth Africa (eHA) used advanced geographic information systems (GIS) technologies to build on John Snow’s ideas of mapping. eHA uses data-driven solutions and tools to improve community health, with specific expertise in the design, development, validation, and deployment of predictive models for diseases like cholera.

GIS allow experts to explore different aspects of a geographical point. The identification of patterns can drive insights and enable health stakeholders to make informed decisions about how to best plan public health interventions. Due to computational and technological advancement, GIS has been used in public health for epidemiology, resource planning, and surveillance among others.  

NCDC and eHA were able to utilize GIS capabilities to enhance the data management within the NCDC National Incident Coordination Centre (ICC). The ICC serves as a the emergency operations center for coordinating disease outbreaks at the national level.


eHA’s GIS and Data Analytics team works with the NCDC to map cholera hotspots (areas where cholera persists) across Nigeria’s Local Government Areas (LGAs). At the start of the outbreak, hotspot analysis helps determine where to vaccinate and what quantity of vaccines are required per LGA. This exercise ensures the effectiveness of the oral cholera vaccine immunization campaigns which are rolled out to stop the spread of disease.

In planning, data from 2012-17 displays the spread of cholera outbreaks and also shows the relative risks of the various LGAs which have reported an outbreak during the five year period.

The Big Picture Data Source: Nigeria Centre for Disease Control

The Big Picture Data Source: Nigeria Centre for Disease Control

Data Source: Nigeria Centre for Disease Control

Data Source: Nigeria Centre for Disease Control

We layered the 2018 outbreak data with the historical hotspot analysis to identify specific trends and possible overlaps. The result of the hotspot analysis identified 83 LGAs as hotspots, with 87% reporting at least one case with over 70% of the burden from Bauchi, Kano, and Zamfara states. The LGAs identified as hotspots have enabled the government to make informed decisions about where to request vaccines to ensure that the most vulnerable areas are supported.

Data Source: Nigeria Centre for Disease Control

Data Source: Nigeria Centre for Disease Control

We continue to collaborate with the NCDC to strengthen cholera surveillance in Nigeria. The partnership ensures that data management and analysis expertise contribute to faster response and informed decision making before, during and after outbreaks.

This work was done in collaboration with the following partners:

  • Yennan Sebastian- NCDC

  • Adesola Ogunleye - NCDC

  • Heloise Lucaccioni - UNICEF

  • Helen Adamu - UMB

  • Kobi Ampah- WHO Geneva